

Debugging during execution
Table of Contents
Intermediate - This article is part of a series.

When running a load test via the command line, some errors may occur. It’s possible to use the tail command on the JTL results file to get an idea of the error code or some information about the response message. This information may be ambiguous or insufficient. Therefore, when you have requests or transactions with a low error rate (by low error rate, I mean less than 20%), there are ways to obtain more information, such as enabling listeners to save the responses to a flat or XML file. There is also a fairly efficient solution that I’ve also shared on the Flood.io site.
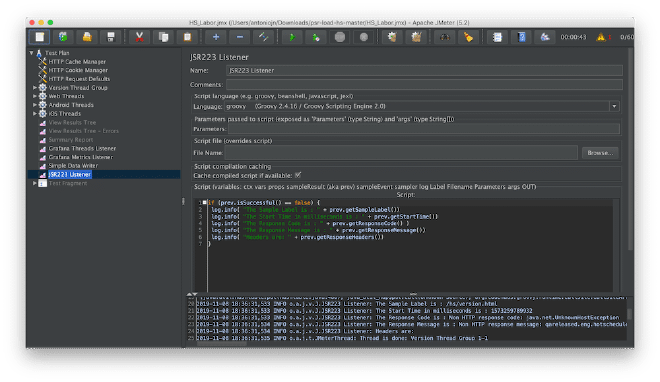
This solution consumes few resources and can send any associated response values to the JMeter log so we can analyze them in detail. This solution is to use a JSR223 listener, which must contain the following code:
if (!prev.isSuccessful()) {
  log.info("The Sample Label is : " + prev.getSampleLabel());
  log.info("The Start Time in milliseconds is : " + prev.getStartTime());
  log.info("The Response Code is : " + prev.getResponseCode());
  log.info("The Response Message is : " + prev.getResponseMessage());
  log.info("Headers are: " + prev.getResponseHeaders());
}
It is extremely important that the script caching be active and that it be the Groovy compiler as well. It should also be placed at the test plan level, especially if there are multiple thread groups or if only one group of threads exists.
Here is an example of more recent content that includes the response to sending it to the JMeter’s logbook.
if (prev.isSuccessful() == false) {
    log.info( "###########################################################")
    log.info( "The Sampler Label is : " + prev.getSampleLabel())
    log.info( "The Sampler payload is : " + prev.getSamplerData())
    log.info( "The Start Time in milliseconds is : " + prev.getStartTime())
    log.info( "The Response Data is : " + prev.getResponseDataAsString())
    log.info( "The Response Code is : " + prev.getResponseCode())
    log.info( "The Response Message is : " + prev.getResponseMessage())
    log.info( "Headers are: " + prev.getResponseHeaders())
    log.info( "###########################################################")
}
What does the code do? #
The code evaluates all sampler responses, and if the sampler is marked as failed, the following data will be sent:
- Tag name
- Timestamp
- Response code
- Message response
- Headers
If you want to add any other values, I recommend checking here, which could be useful for your debugging. It’s worth mentioning that this is primarily aimed at HTTP samplers, but you could modify it to capture relevant information from any other protocol.
Conclusion #
The general purpose of this code is to be able to view in real time, using a command like tail, any type of error in the response codes we receive from our requests. This will be saved in the JMeter log (jmeter.log). This is also ideal for storing evidence and documentation of the possible origin of these errors.