

Distributed execution of JMeter (local network)
Table of Contents
Intermediate - This article is part of a series.
One of the most significant features in JMeter is distributed execution, which allows horizontal scaling of the number of load generators. Although it is a less-known feature, it is highly useful or effective when we need to execute only a few thousand threads or virtual users.
Why is it little known? #
It really is little known because there are specialized companies that provide this automation in the cloud as Flood.io, Blazemeter, and Octoperf among others. Additionally, it can be a laborious task that consumes a lot of time; there would need to be an assessment of the cost-benefit of implementing this scheme for some particular case.
When is it prudent to undertake the effort? #
If you need to perform a load or stress test between 2,000 and 8,000 threads or virtual users, I recommend using this approach. Beyond that, I would not recommend it because creating, cloning, configuring, and monitoring generators of loads, especially if it is one person who is designated for all these tasks, can take a lot of time, even if you are the only one responsible for them. For executions above 8K, I would suggest looking into Cloud SaaS Load Testing options as we previously mentioned or also using containers, which will be part of this series of JMeter distributed posts.
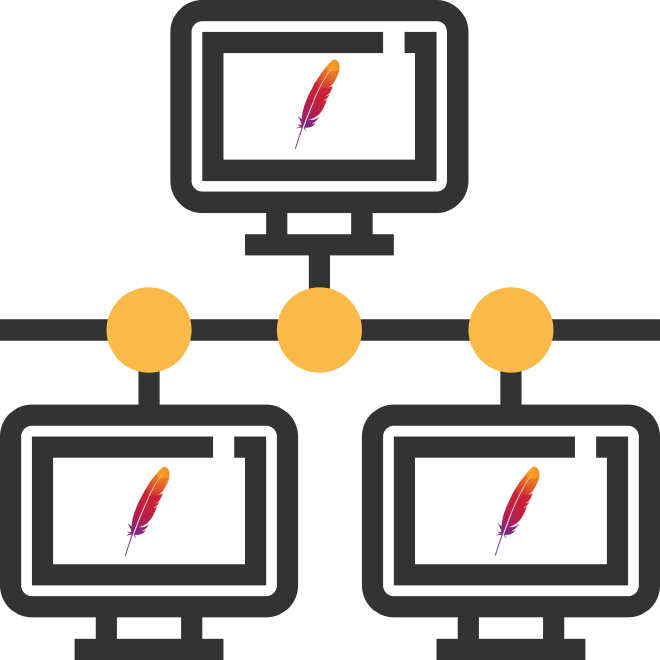
How it works? #
It operates in master-slave mode, which means we need a node or server to function as the controller/orchestrator and the remaining servers would be nodes/injectors of load ( load generators). This scheme only works within the same network, meaning we would have to subnet for all devices to be interconnected. Without further ado, let’s see what we need:
- Controller aka Master aka Orchestrator (Windows) x 1
- Firewall disabled
- Java 1.8+
- JMeter 5.2.1
- Node aka Load Generator aka Load Injector (Linux Ubuntu) x 4
- Java 1.8+
- JMeter 5.2.1
The version of JMeter 5.2.1 should be the same on all machines, the Java version is different in the master node compared to the nodes, but it is recommended to use the same version of Java on all machines.
Recipe for cooking #
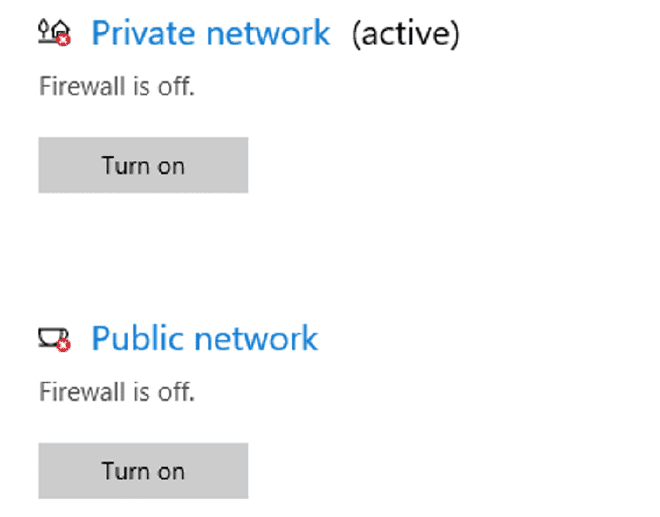
1.- Firewall - Controller #
We need to disable the Windows firewall to allow bi-directional connection between master and nodes. Choose Windows Server 2019 for this example because it is easier to show execution in the graphical environment, although you could also use a Linux GUI. It is possible to do it from the CLI as well, I will provide an example that would be of great use if no graphical environment or for those who love CLI.
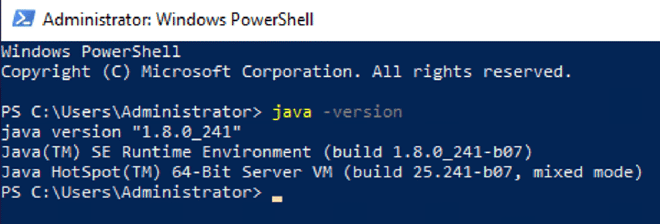
2.- Java - Controller #
Install Java 1.8+ for this example, I used Java 1.8 JRE, you can download the latest version of Java here.
3.- JMeter - Controller #
Download and install JMeter 5.2.1 (the latest version known until this publication), if you have any doubts, you can see this publication. If you need plugins or data files (CSV or images), you will have to install them manually in each generator of load testing, since these files are not transmitted via RMI.
4.- Properties - Controller #
Edit the file jmeter.properties to add the IP addresses of remote hosts or nodes (see step #6) and also to disable RMI security. This is a more lengthy process, but we’ll start with the simpler path first.
#remote_hosts=127.0.0.1  //original

remote_hosts=10.223.2.71,10.223.2.78,10.223.2.63,10.223.2.58  //editada
#server.rmi.ssl.disable=false   //original

server.rmi.ssl.disable=true     //editada
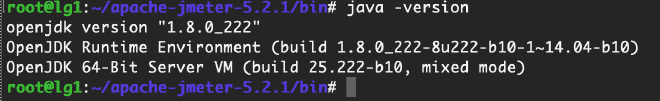
5.- Java - Nodes #
Install Java 1.8+ on each node, even though if you are using cloud services, I recommend doing this task once and creating an image to generate the other servers from that image. Although in any case you will need to verify the following steps for each of the nodes. For this example, I used Linux Ubuntu, here you can see a recipe for installation.
6.- JMeter - Nodes #
Download and install JMeter 5.2.1 (the latest known until this publication), if you have any doubts, you can see this publication. We can use a simple wget to download the tar ball version, for decompressing it we can use the command tar.
wget https://downloads.apache.org//jmeter/binaries/apache-jmeter-5.2.1.tgz

tar -xvf apache-jmeter-5.2.1.tgz
7.- IP Address - Nodes #
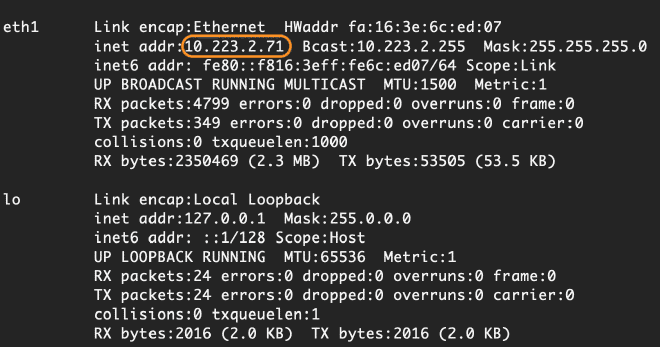
To obtain the IP address of each node server for insertion in step #4, it may seem recursive, but this value is necessary for steps #4 and #9. The simplest way to get the value is by using the command ifconfig, as shown below:
The IP address would be: 10.223.2.71
8.- Properties - Node #
Edit the file jmeter.properties in the nodes to disable RMI security. As already mentioned, it is a bit more lengthy process enabling security, but since we are on a local network, it should not be necessary.
#server.rmi.ssl.disable=false   //original

server.rmi.ssl.disable=true     //editada
9. Edit JMeter Service - Controller #
Edit the file jmeter-server, this file contains the configuration of the JMeter service for remote host or node mode, that is, we must configure the internal network IP address of the node so it can receive requests from the master or controller.
#RMI_HOST_DEF=-Djava.rmi.server.hostname=xxx.xxx.xxx.xxx   //original

RMI_HOST_DEF=-Djava.rmi.server.hostname=10.223.2.71     //editada
10.- Start JMeter service - Controller #
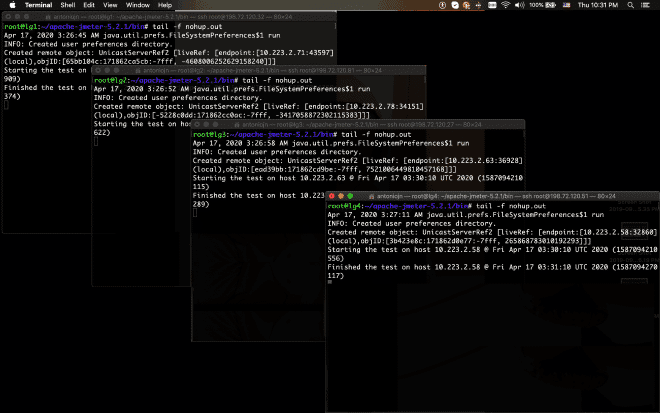
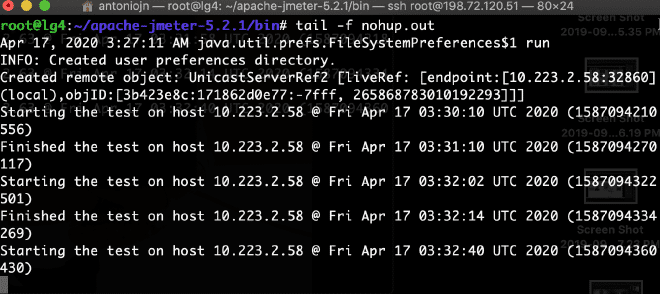
Start the service jmeter-server, this service needs to be executed for the node to listen to commands from the master. I recommend using nohup and running it in background with &. In case you lose connection to the node via SSH, but the service continues to function, something like this:
nohup ./jmeter-server &
tail -f nohup.out
At the end, I recommend monitoring the output file of the session via SSH with the command tail.
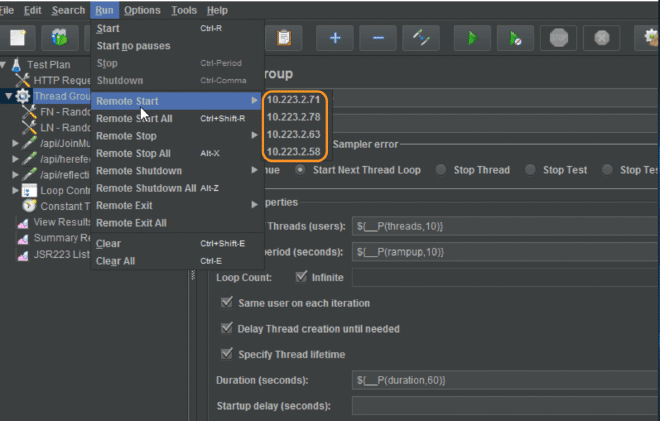
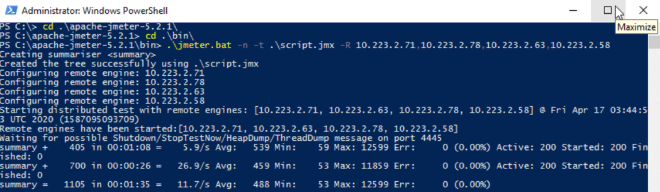
11.- Execution - Controller #
Once the nodes are configured and listening, these will be visible to the master or controller. For this example, use a script with minimal load, just 10 threads. It should be noted that there are 10 threads per generator, resulting in concurrent execution of 40 threads.
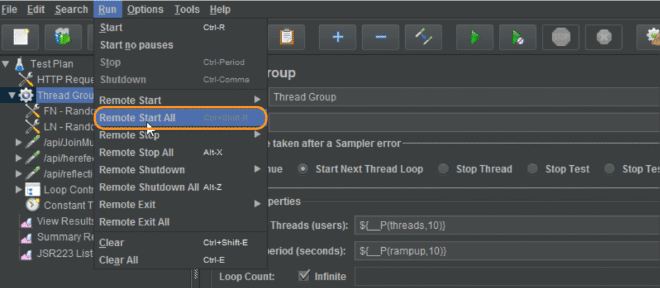
12. Validation #
Validate that nodes are receiving communication from the master and executing the script.
I hope they were able to reproduce this scenario. If not, check that all nodes and master are within the same network. In my example, they are in the network 10.223.2.0/24. If using AWS or Azure, ensure they are within the same subnet and VPC. I will soon publish how we can see these results in Grafana.
To conclude, I leave you with the execution from the command line.
jmeter.bat -n -t script.jmx -R 10.223.2.71,10.223.2.78,10.223.2.63,10.223.2.58
Conclusion #
This dynamic works well on Azure and AWS, which are the largest providers of Cloud IaaS in the cloud, I have not tested it on Google but I imagine it should also work. As you can see here, we continue with manual tasks that need to be evaluated based on cost-benefit analysis due to these tasks could take some practice to improve skills and above all fail a little to see possible pitfalls where we might get stuck. Do not hesitate to contact us if you need help.