

JMeter (Elasticsearch + Kibana)
Table of Contents
Advanced - This article is part of a series.

What is Elasticsearch? #
Elasticsearch is a distributed search and analytics engine that also serves as an open source project. The engine supports a wide variety of data types, including textual, numerical, geospatial, structured, and unstructured. Elasticsearch was developed in Apache Lucene and first presented by Elasticsearch N.V. (now known as Elastic) in 2010. Known for its simple RESTful API, distributed nature, speed, and scalability, Elasticsearch is the main component of the Elastic Stack, a collection of open-source tools for ingesting, enriching, storing, analyzing, and visualizing data. Commonly referred to as the ELK Stack (for Elasticsearch, Logstash, and Kibana), the Elastic Stack now includes a large number of agents known as Beats that send data to Elasticsearch.
Text extracted from here and I recommend visiting it for information on all the benefits of Elasticsearch.
What is Kibana? #
Kibana is an open source frontend application that resides on the Elastic Stack and provides data visualization and search capabilities for indexed data in Elasticsearch. Commonly known as the front-end tool for the Elastic Stack (previously called ELK Stack by Elasticsearch, Logstash, and Kibana), Kibana also acts as a user interface to monitor, manage, and secure an Elasticsearch cluster; it is also a centralized hub for integrated solutions developed in the Elastic Stack. Developed in 2013 by the community of Elasticsearch, Kibana has become the window into the entire Elastic Stack offering a portal for users and enterprises.
Text extracted from here and I recommend visiting it to inform yourself about all the benefits of Kibana.
How does the integration of Elasticsearch and Kibana work with JMeter? #
The integration is quite simple but not very popular. Just like the previous publication JMeter with InfluxDB and Grafana, we will use the Backend Listener component, but modified and adapted to send data to Elasticsearch. The JAR file can be downloaded here, this plugin was created by Anthony Gauthier based on the original backend listener code. This receiver component sends data to Elasticsearch via asynchronous HTTP requests, and obtains results from JMeter in JSON format.
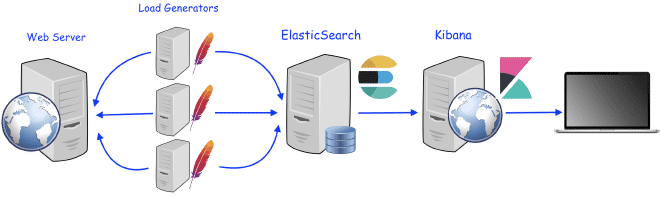
The receiver will send all the results described here to ElasticSearch, whether you place it as a backend listener at the test plan level or within a specific thread group. The results will be transmitted to ElasticSearch up to a maximum of 5000 objects, each object can contain multiple measurements or values. Data is emitted in HTTP POST requests to the Elasticsearch API once we validate that the data exists on the index we choose, and we can build a dashboard in Kibana or even in Grafana to display the results. Don’t worry if you don’t know how to do it; there are many pre-defined dashboards available in the community of Kibana and Grafana for visualizing JMeter’s results.
What We Need ? #
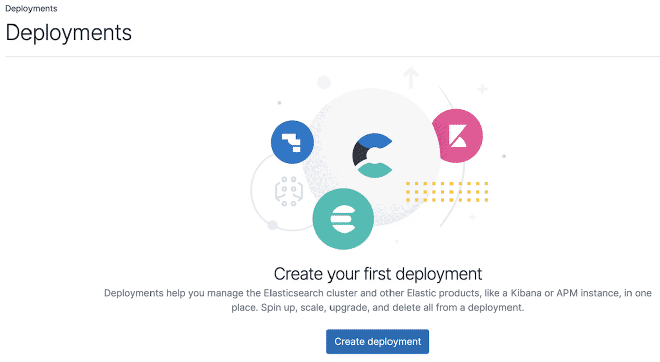
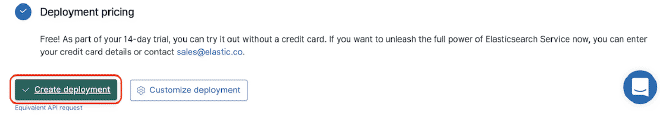
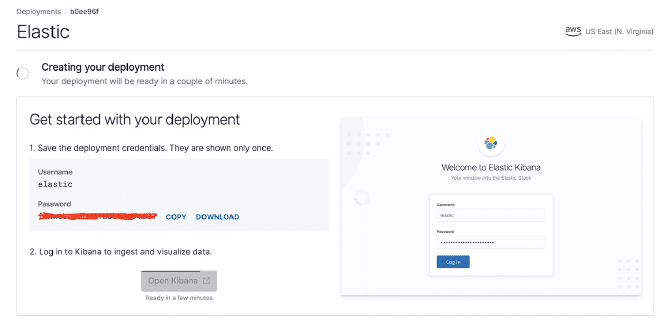
We need an instance of ElasticSearch, I recommend using the Cloud trial version of Elastic that gives you 14 days of a cluster consisting of (ElastiSearch, Kibana and Enterprise Search), which is more than enough for this test. You can also download and install ElasticSearch on your device or use a dedicated server. If you don’t want to install it, you can download and run the version Docker.
We need a Kibana instance. When you open your cloud account, this instance is included in the Stack. You can also download and install Kibana on your device, or use the same InfluxDB server. If you don’t want to install it, you can opt for the version Docker.
Alternatively, we need an instance of Grafana, after opening your account on grafana.com, you can generate a Grafana Cloud instance here. This instance would be sufficient for this test. You can also download and install Grafana on your device or use the same InfluxDB server. If you don’t want to install it, you can opt for the Docker version .
Add the Backendlister to a JMeter script and configure it with the information from point #1.
Validate that the information is available in Elasticsearch.
Build our own tables or use existing ones to display the results’ graphs.
Recipe #
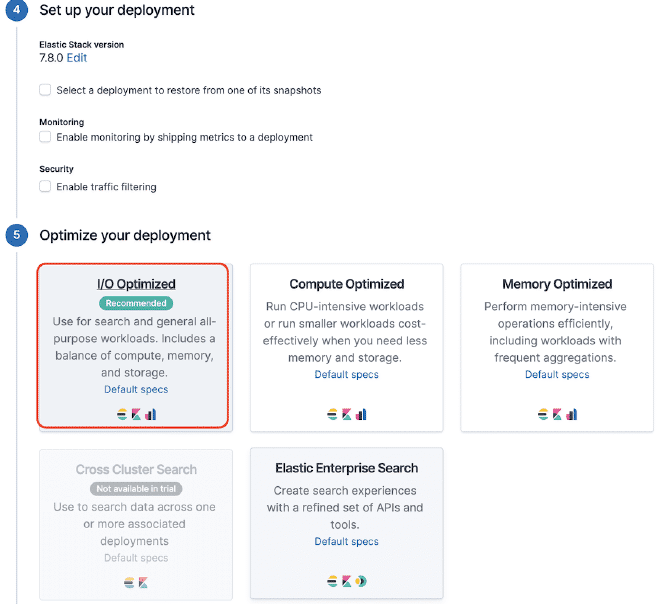
1.- ElasticSearch and Kibana Version for Testing #
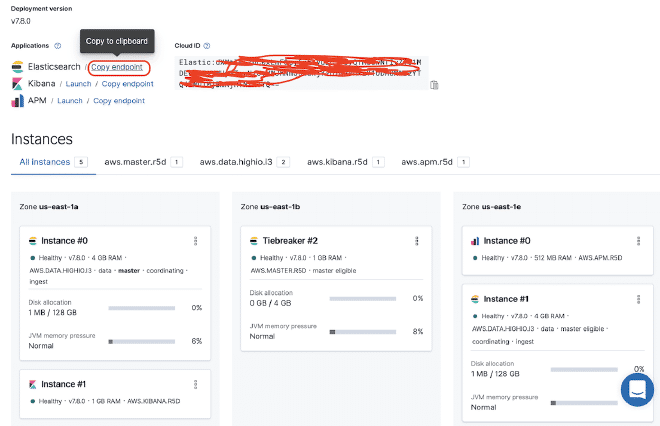
We will use the test version of Elasticsearch, as you can see in the images. By obtaining a URL where our API service https://50e0522e55014a12ae25707525ba6e95.us-east-1.aws.found.io:9243.
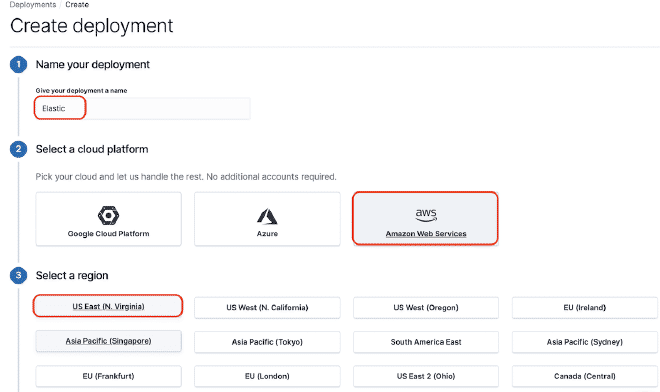
Click the red box to get the ElasticSearch link. For this example, it is https://50e0522e55014a12ae25707525ba6e95.us-east-1.aws.found.io:9243
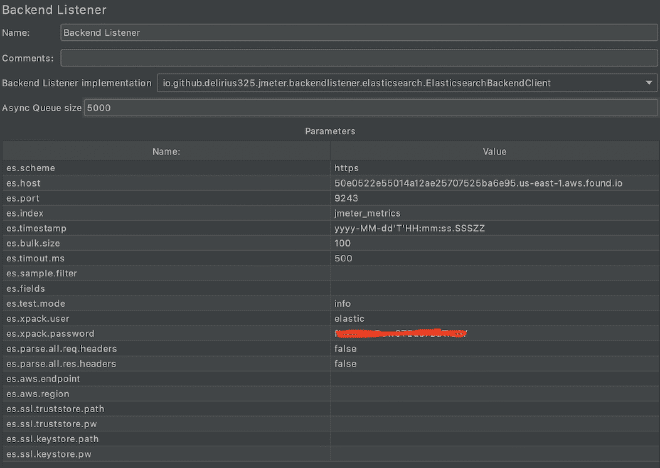
2.- Configure the Backend Receiver #
We need to copy the file jmeter.backendlistener.elasticsearch-2.7.0.jar to our /lib/ext directory and restart JMeter. Then, add and configure the Backend listener component with the data from step #1 as we have already mentioned: the URL is Elastic, and the username and password are obtained from previous images.
- the protocol or es.scheme = https
- the name of the server or es.host = 50e0522e55014a12ae25707525ba6e95.us-east-1.aws.found.io
- the port or es.port = 9243
- the index or es.index = jmeter_metrics
- the user of elastic or es.xpack.user = elastic
- the password of the user or es.xpack.password = secret
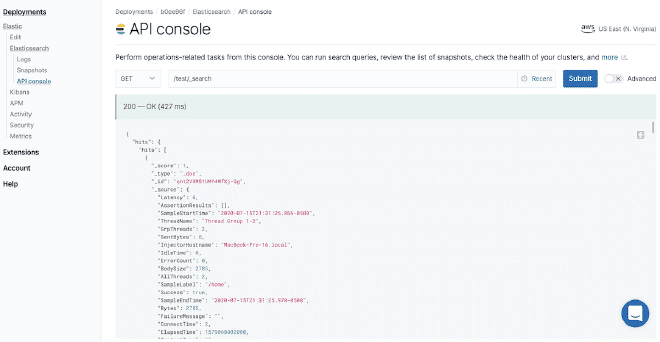
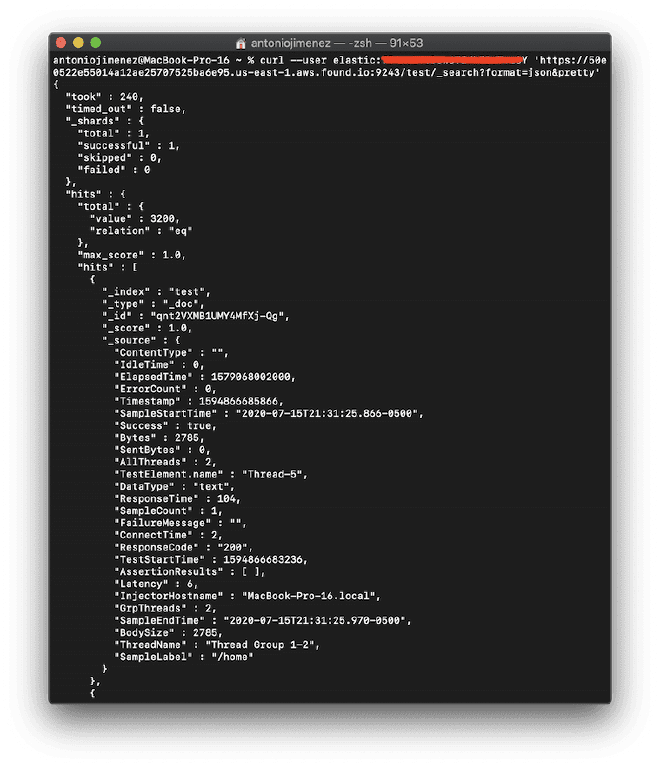
3.- Test with CURL #
Run a small test and validate using the API Console that the information is being correctly deposited in Elastisearch. We can also use the CURL command:
curl --user elastic:secret 'https://50e0522e55014a12ae25707525ba6e95.us-east-1.aws.found.io:9243/test/_search?format=json&pretty'
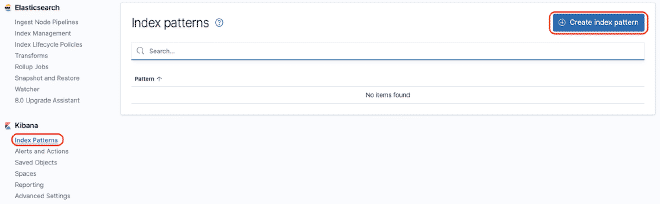
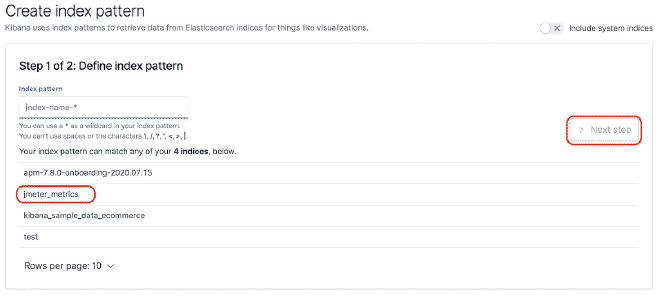
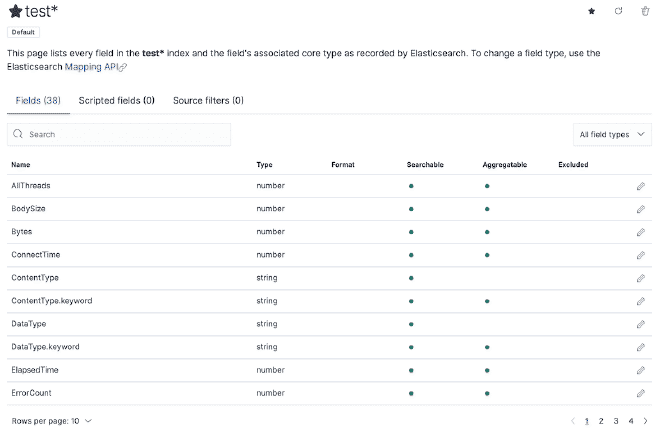
4.- Build the dashboard #
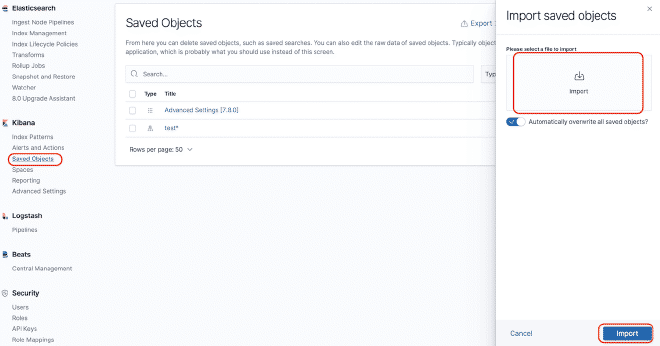
You can build a dashboard in Kibana to be able to graph the data that were sent to Elasticsearch. For this example, we will use the dashboard JMeter Metrics Statistics Dashboard, which only requires us to copy the JSON and import it into Kibana Objects. However, before that, we also need to configure the data index so that Kibana can extract them from Elasticsearch.

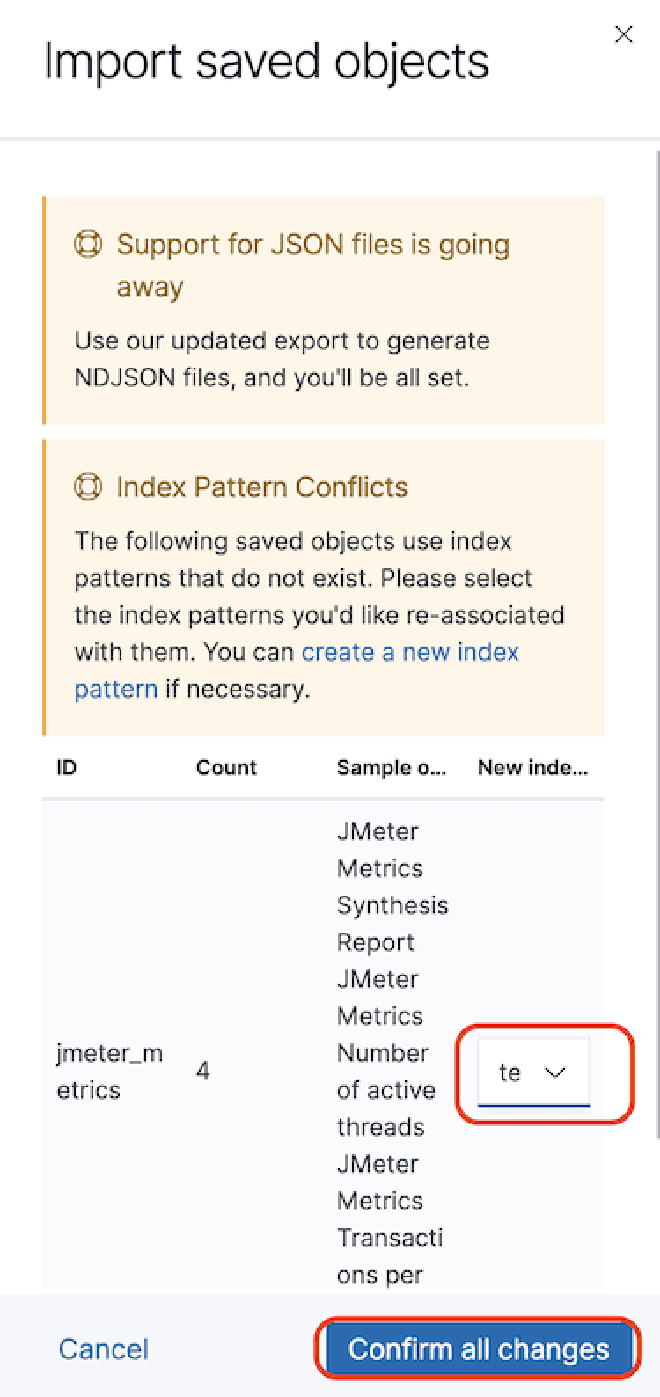

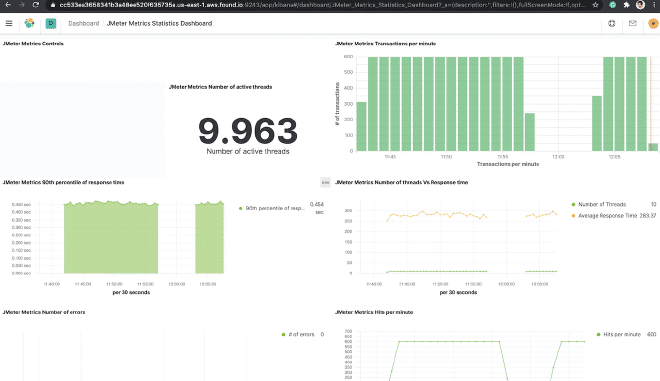
In case of time stamp problems, we need to edit the “dashboard” and then “edit the visualization” of the component. Select the “Panel Options” tab and in the field “Time Field,” select the value “SampleStartTime.” Save and enjoy the Dashboard.
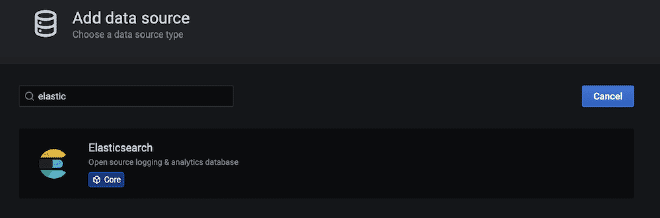
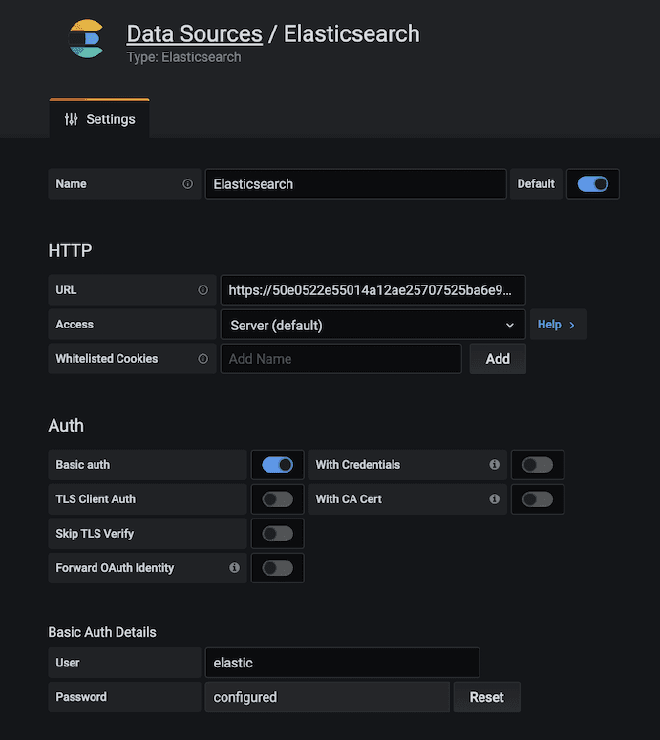
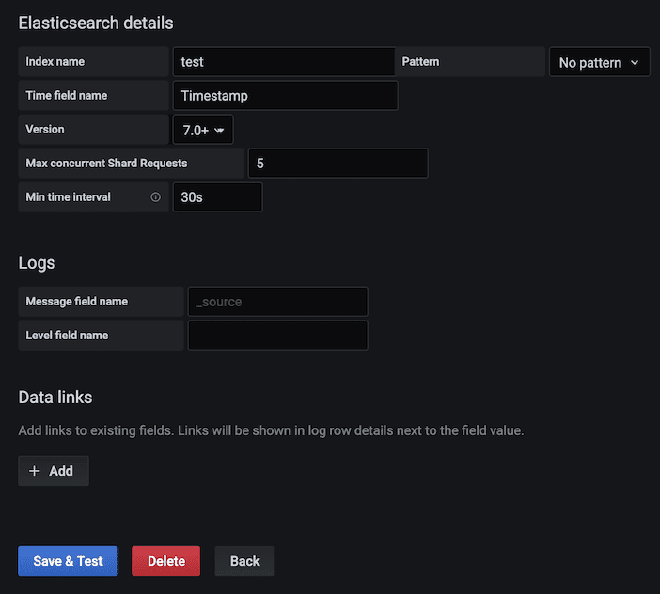
5.- Alternating using Grafana #
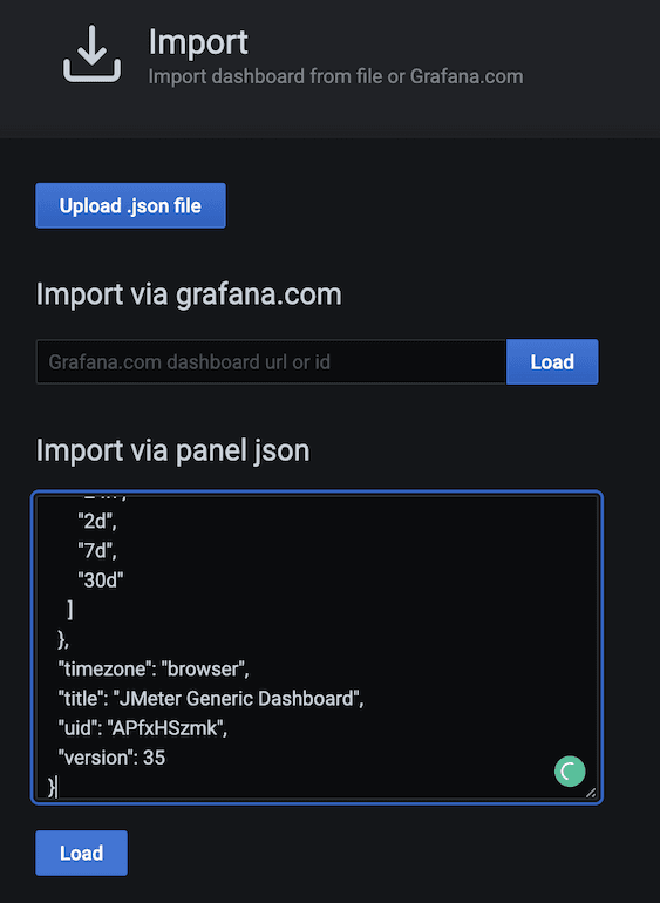
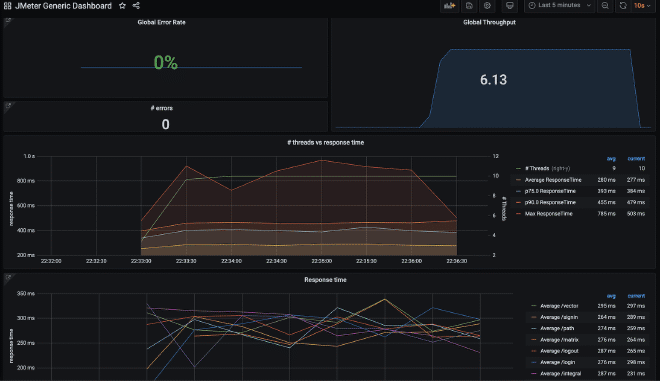
You can build a similar dashboard in Grafana to graph the data that was sent to Elasticsearch, the easiest way is to use pre-defined dashboards created by some users of the Grafana community, these are available at the following link. For this example we will be using the dashboard Grafana Main Dashboard, which only requires us to copy and import the JSON into Grafana. However, before that, we also need to configure the data source connection between Grafana and Elasticsearch.

Conclusion #
This solution has also worked for thousands of concurrent users, as it is very simple to horizontally scale Elasticsearch. While Kibana or Grafana with the Cloud instances are sufficient, I invite those who become more experienced to create their own tables in Kibana or Grafana or modify existing ones, which is quite easy and extremely useful. Because you can also send counters for CPU, Memory, Disk Space, and Bandwidth of load generators or target servers using Logstash.
Alternatively, we could send the contents of our JTL file via Logstash, potentially eliminating the need to collect JTL files after iterations if necessary, although this Listener is different from the previous article on InfluxDB, allowing us to save all fields and results without needing to store the JTL file if required for reconstruction.
Similarly to sending metrics of counters to Elasticsearch, we could correlate the levels of load with CPU, Memory and I/O counters to measure the performance of target servers. Therefore, even though JMeter is a load testing tool, it can be easily integrated with these add-ons to measure performance.
To finalize, if you’d like to compare your results using CI/CD environment variables, Anthony Gauthier left us a gift here. Good luck!