

JMeter (InfluxDB + Grafana)
Table of Contents
Advanced - This article is part of a series.

What is InfluxDB ? #
InfluxDB ( https://www.influxdata.com/) is a time series database service, ideal for storing numerical or real-time results. The success of InfluxDB lies in its GoLanguage implementation, which makes it perform better than other time series databases (time series DBMS). We could implement the solution from this article with Graphite, but I believe it would only be recommended if you needed to compare results or perform “benchmarking”.
The administration, writing and/or reading of data in InfluxDB can be done through its service API, which receives requests over HTTP protocol and executes operations in the language InfluxQL (similar to SQL) on our database. The ingestion can be either unitary or batched, meaning that it can send a request HTTP with one or more measurements simultaneously. Also, bulk ingestion or raw data in CSV format could be performed, but this would fall outside of our scope. I recommend visiting this article to play around with InfluxDB. Lastly, but no less important, InfluxDB is an open-source project.
What is Grafana? #
Grafana is a tool for visualizing dashboards and graphs that are fed by metric data from time-series databases. This is limited to an implicit or windowed timeframe, meaning only the dashboard can be scoped to a specific time window. Similarly, both Grafana and InfluxDB are written in GoLanguage and also open source projects.
This tool can help us understand and/or analyze behaviors or patterns by using the simplicity to modify time windows, recalculating values on a new window after changes are made. We can easily see historical CPU or Memory behavior of one or more servers per day, week, month, or year. With this information, we can understand current consumption habits and predict future behaviors.
How does the integration of InfluxDB and Grafana work with JMeter? #
The integration is quite simple and popular, so much that there’s a native component in JMeter for this integration called the Backend Listener. This listener receives requests from JMeter via asynchronous HTTP calls to InfluxDB. The results obtained by JMeter through blocks can be stored in InfluxDB, which can then be read or graphed on a Grafana dashboard for visualization.
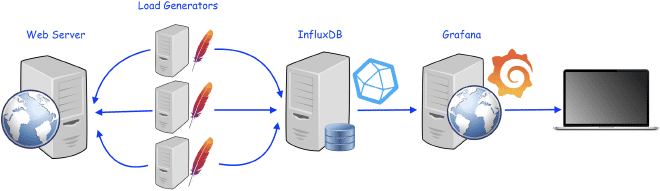
The receiver will send all the results described here to InfluxDB, either placed at the backend listener level within the test plan or inside a specific thread group. The results will be sent to InfluxDB in a maximum of up to 5000 lines, each line can contain multiple measurements. By the way, that wouldn’t mean much effort for InfluxDB. Data is transmitted via HTTP POST requests to the InfluxDB API, it would be good to have one user for writing and another for reading (for security). Once you’ve validated that the data is entering correctly, we can build a dashboard in Grafana to display the results. Don’t worry if you don’t know how to do it; there are many pre-defined dashboards available on the Grafana community to visualize JMeter’s test results.
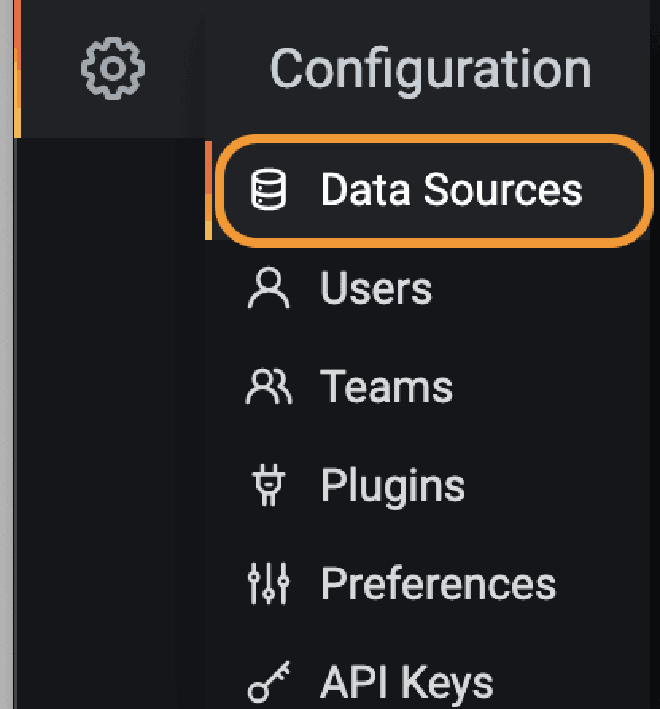
What we require? #
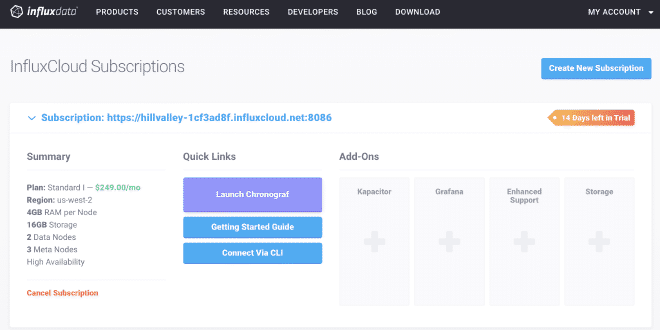
We need a database in InfluxDB. InfluxData gives you a 15-day trial period with an instance of up to 4 vCPUs and 16 GB of RAM, which is more than enough for this test. You can also download and install InfluxDB on your computer, or use a dedicated server. If you don’t want to install it, you can download and run the Docker version.
We need a Grafana instance. When you open your account at grafana.com, you can generate a Grafana Cloud instance. This instance would be sufficient for this test. You can also download and install Grafana on your computer, or use the same InfluxDB server. If you don’t want to install it either, you can also opt for the Docker version.
Create a database in InfluxDB and create a user for reading and writing (the same user can be used for both tasks).
Add the backend listener to a JMeter script and configure it with the information from step #1.
Validate that the information is available in InfluxDB.
Build your own dashboards or use existing ones to display the results graphs.
Recipe for cooking #
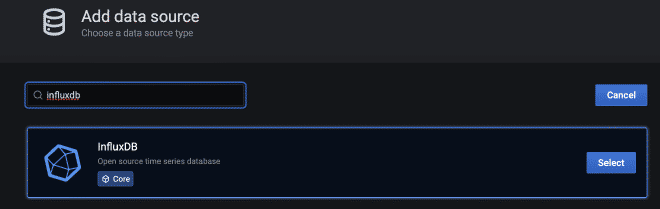
1.- InfluxDB version and create a database #
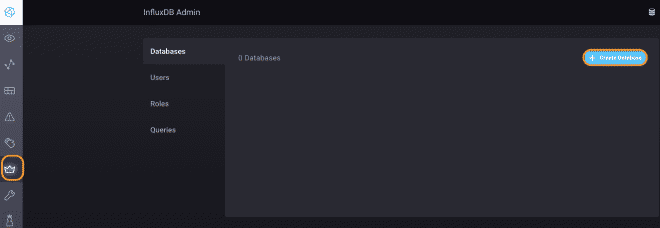
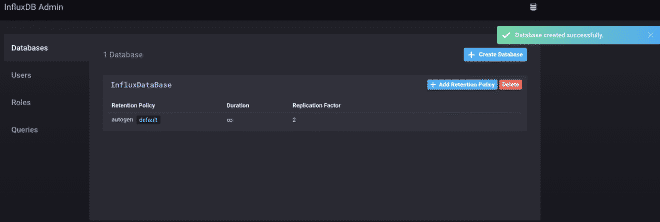
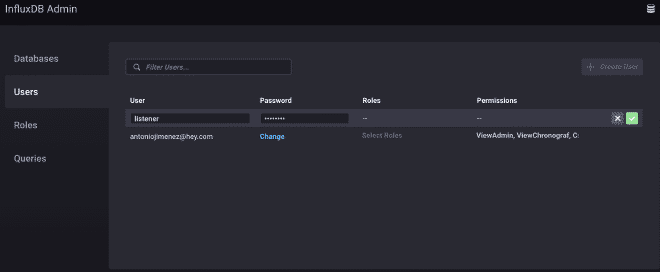
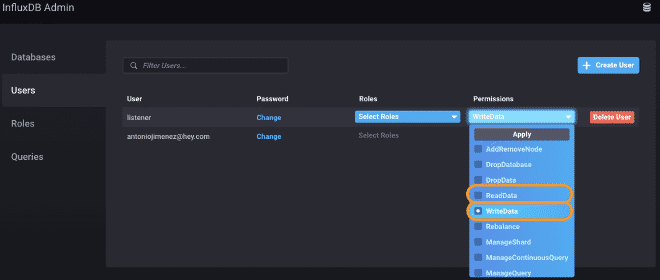
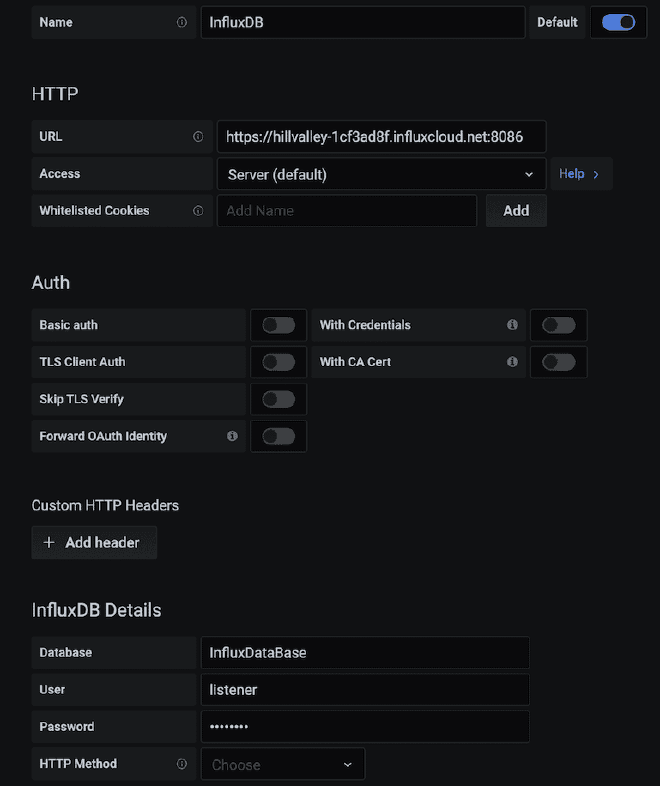
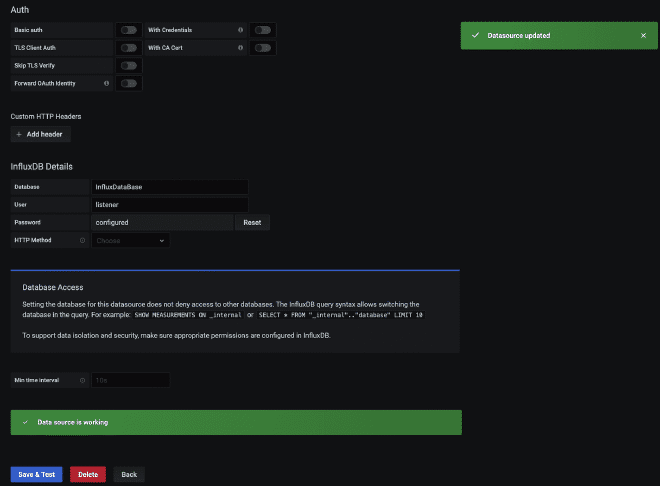
We will use the InfluxDB test version, as you can see in the images. We obtain an URL where our API service is located https://hillvalley-1cf3ad8f.influxcloud.net:8086. When launching Chronograf, we select the option for InfluxDB administration to generate our database, which will be called InfluxDataBase. We also create the user listener and its password. To simplify interaction with this user, it can read and write data, with the purpose of being used by JMeter and Grafana.
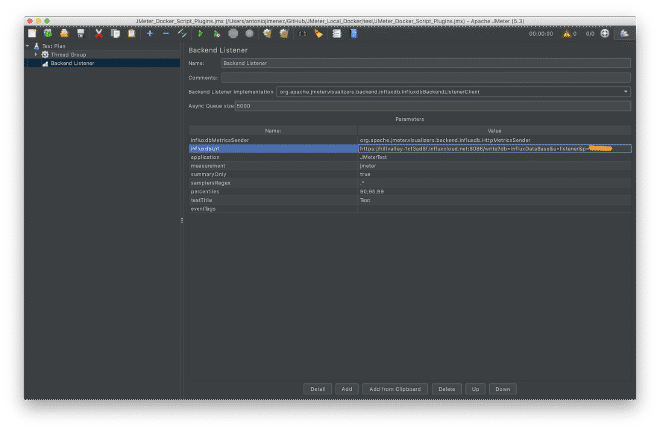
2.- Configure the Backend Receiver #
We need to add and configure the Backend listener with the data from step #1, as we had already mentioned that the URL is https://hillvalley-1cf3ad8f.influxcloud.net:8086, but also we need to specify the database to which we want to write the results and also authenticate the user and password with which we will interact. Fortunately, these values can be sent as parameters in the following url: https://hillvalley-1cf3ad8f.influxcloud.net:8086/write?db=InfluxDataBase&u=listener&p=password, where db is the database InfluxDataBase, u is the user listener and p is the password password. After configuring this, we will make a small test of some concurrent users.
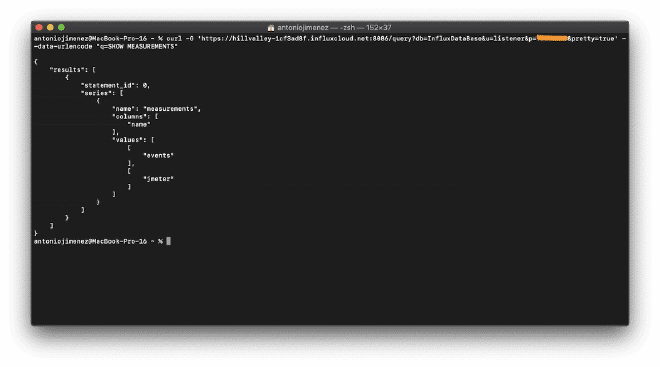
3.- Validate DB API connections #
1.- curl -G ‘ https://hillvalley-1cf3ad8f.influxcloud.net:8086/query?db=InfluxDataBase&u=listener&p=password&pretty=true' –data-urlencode “q=SHOW MEASUREMENTS”
2.- curl -G ‘ https://hillvalley-1cf3ad8f.influxcloud.net:8086/query?db=InfluxDataBase&u=listener&p=password&pretty=true' –data-urlencode “q=SELECT * from jmeter limit 2”
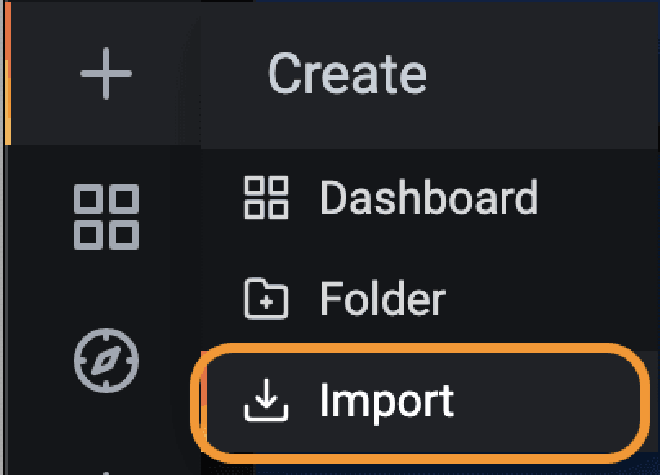
4.- Grafana Dashboard #
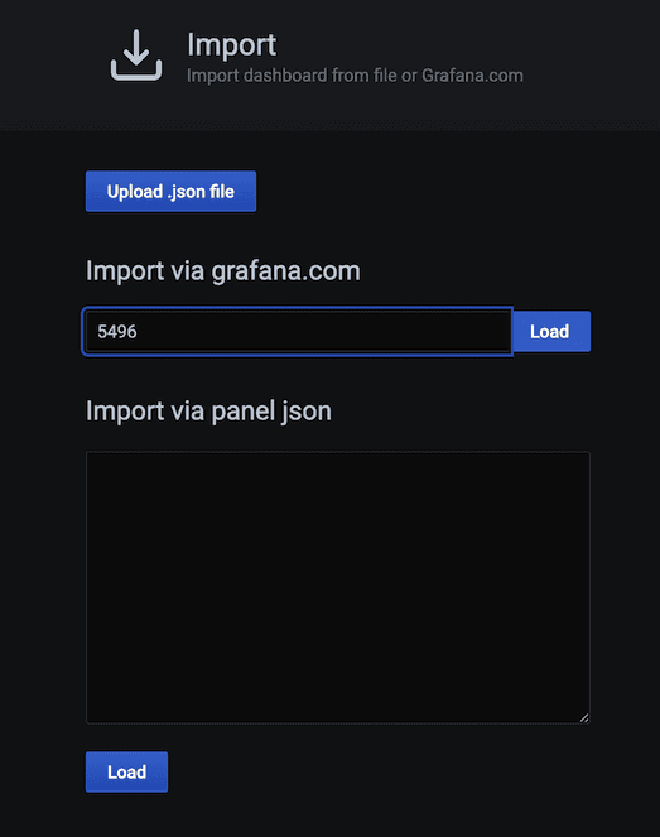
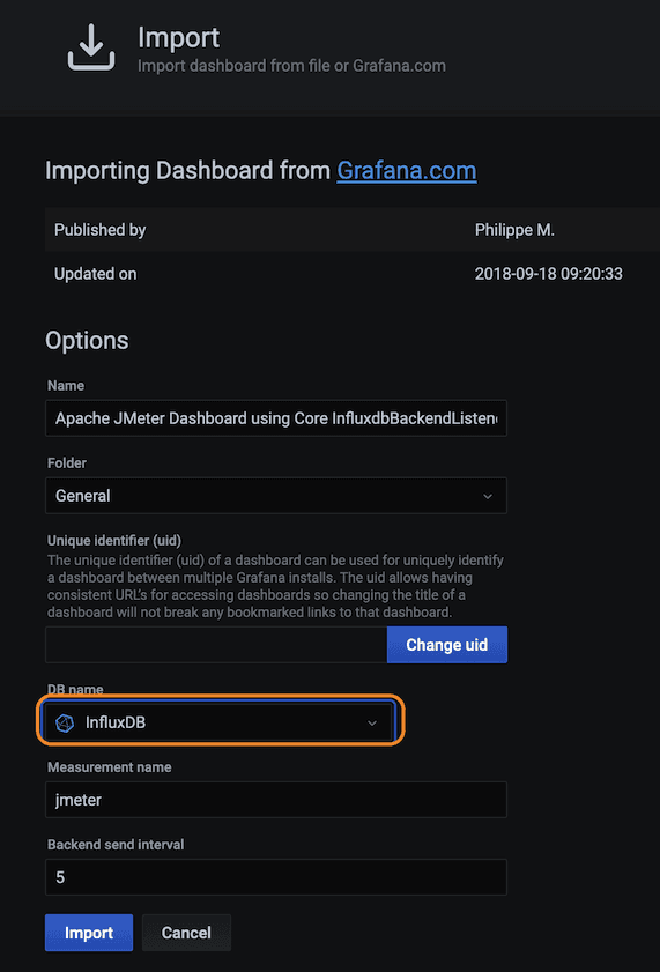
You need to build the dashboard in Grafana so you can graph the data that was sent to InfluxDB. The easiest way is to use pre-defined dashboards created by some users of the Grafana community, which are available at this link. For this example, we will be using the dashboard with the number #5496, which you can simply copy and paste into Grafana. However, before configuring the data source connection between Grafana and InfluxDB, you must first set up the connection.
Conclusion #
For this article I based part of my 2018 publication and you can consult it here. The publication is in English and uses two receivers JSR223 with programming language Groovy, with a logic very similar to the one used by the Backend Listener, however there are some differences regarding the format and data sent to InfluxDB. Also, the tables of Grafana were specially designed for that format, so they are not compatible with this article. I did not cover that material because my intention is to provide a simple solution. When you feel more advanced, please use or modify the code from said publication.
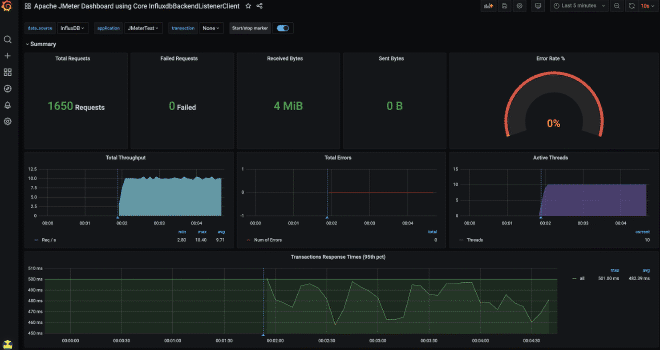
This solution has worked for thousands of concurrent users because it is very easy to horizontally scale InfluxDB, while Grafana even with the Cloud instance is sufficient. If they have more experience, I invite you to create your own tables in Grafana or modify existing ones, it is quite simple and very useful. Because also it can send counters of CPU, Memory, Disk, and Bandwidth from their load generators or target servers using telegraf or the solution shared by Delvis in this monitoring, with the purpose of quantifying and correlating load levels with consumption levels, so we can measure the performance of involved servers.
Welcome to real-time monitoring of your results and consumption levels. Please note that this information is also available on the official JMeter site at the following link. Good luck!