

Basic Monitoring of Your Servers from JMeter
Table of Contents
Beginner - This article is part of a series.

Knowing the health of servers is extremely important, especially to ensure that response times are appropriate for end users. A performance test process does not complete without including a server resource monitoring stage. There are tools that allow you to monitor servers. Many of them have excellent user experience and an enormous community of users who support them; many of them are open source, but in most cases they have a steep learning curve, making their understanding difficult.
JMeter is a load generation tool, but it includes a plugin that provides an excellent and fast way to collect metrics from a server. This plugin is called “PerfMon Metrics Collector”, and it can be found at https://jmeter-plugins.org/wiki/PerfMon/
Using this plugin is possible to monitor CPU, Memory, Disk and networks, its configuration is very simple, with just a few steps you can be controlling the behavior of your servers. It’s basic monitoring but very useful when we want to obtain results quickly about the health of our servers. In this post we are going to offer a tutorial “Step by Step”.
We will present our infrastructure. #
We have a local server, which has an application web that can be accessed from the “localhost”, so our main page will only be accessed by setting the URL: https://localhost. Remember that this tutorial is based on the Windows operating system.
1.- Download the Agent #
JMeter cannot recover server performance metrics on its own, so you need to use the “server agent” which captures performance data and sends it to JMeter. These agents use the open-source SIGAR library. They collect metrics and send them via TCP or UDP protocols to JMeter.
Download the Agent from the following link: https://github.com/undera/perfmon-agent/releases/download/2.2.3/ServerAgent-2.2.3.zip
2.- Copy the agent to the server you are monitoring #
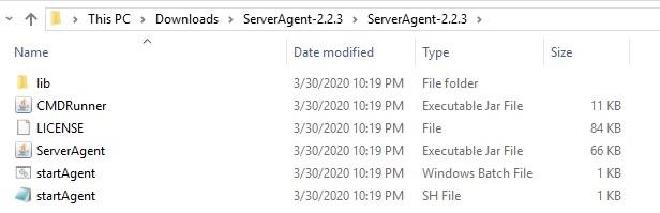
3.- Run the file #
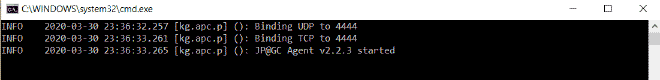
Execute the file “StarAgent.bat” located within the main directory “ServerAgent-2.2.3”. This process will open UDP and TCP ports 4444 automatically and display this console, indicating that the agent is started. If you are using a Linux server, you should execute the file “StarAgent.sh”.
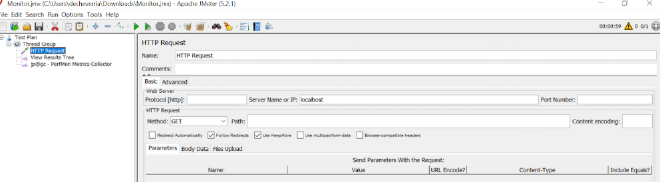
4.- Prepare the Test Plan in JMeter #
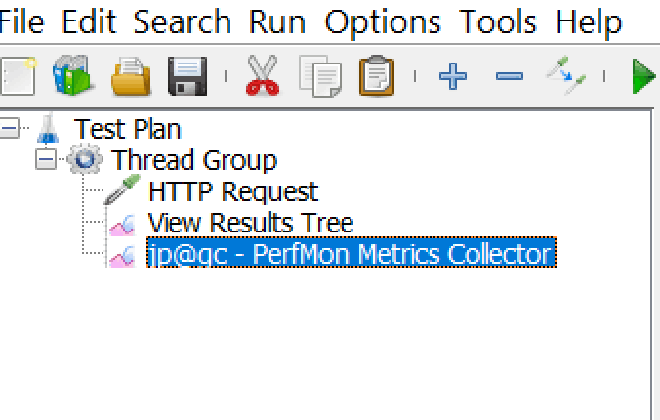
For this example, we will be accessing the URL: http://localhost which is hosted on our server. We will perform a Get to the Home Page. As shown in the following image, we will have only one request “request”.
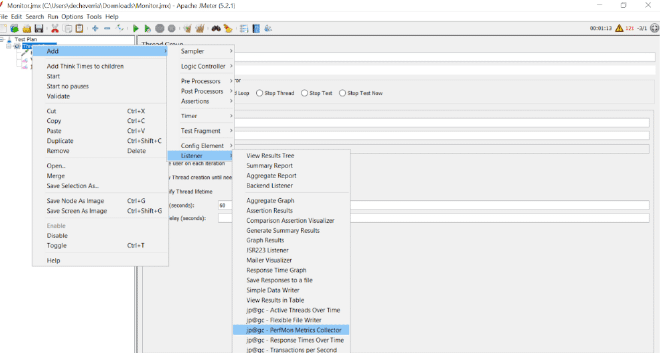
5.- We added the Listener “View Result Tree” and “jp@gc - PerfMon Metrics Collector” #
Through right-click on the test plan -> Add -> Listeners -> To make this last listener visible in JMeter, first it must be added the plugin “Set Standard” from the Plugins.
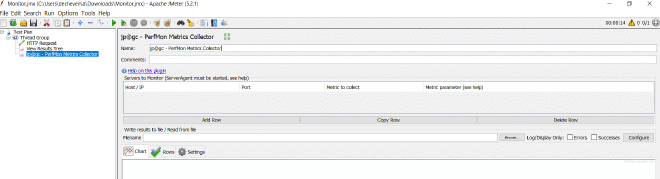
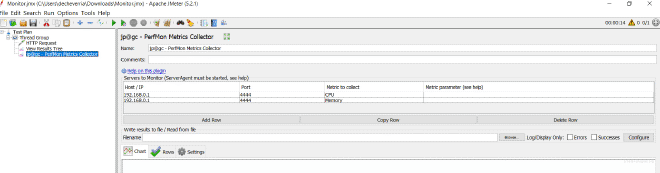
6.- Add the Host, Port, and Metric to Verify via “Add Row” #
For the tutorial example, we will select our localhost server as “Host/Ip”, port 4444, and the metrics we will be monitoring. localhost – 4444 – CPU localhost – 4444 – Memory We will only be verifying the CPU and Memory during our tests. This element should look like this:
7.- Run our script #
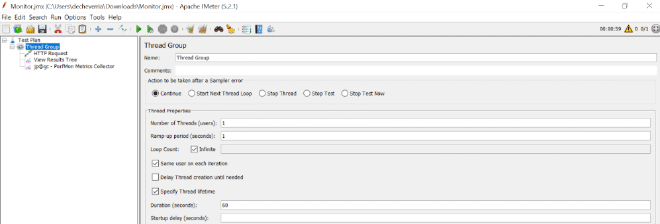
In our case, since we only have a “request http” to the main page (localhost), in the Thread Group we will specify an infinite number of iterations with a 60-second interval, with the objective of delaying our script and clarifying better the results in the “PerfMon Metrics Collector”.
We stop at “PerfMon Metrics Collector” and we will see how the CPU and Memory behave on our server in just a few seconds.
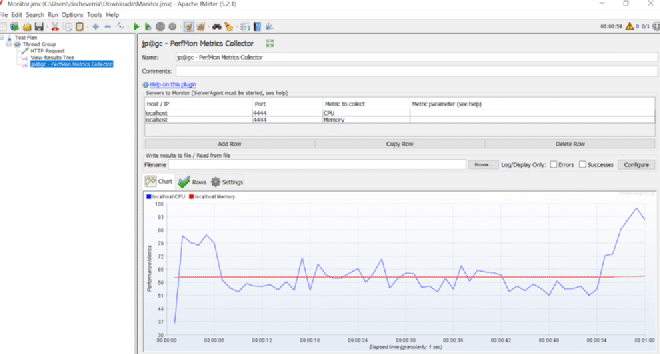
We can observe the behavior of our server over the course of 60 seconds as it is executing our script. In blue, we show the behavior of our CPU and in red, memory usage. If your monitoring has a spike close to 100%, we should be concerned and take care of what happened. As in our case when the CPU almost reaches 100% around the last second.