

Percentiles
Table of Contents
Beginner - This article is part of a series.

Use of Percentiles is Essential #
The evaluation of user experience (UX) is a fundamental aspect in the development of web applications. To compare different sets of UX data, it is common to use statistical measures. The average is a popular measure for describing the performance of a set of users, but using only the average can be misleading and does not adequately represent the overall user experience. That’s why the use of percentiles is essential.
What is a Percentile? #
A percentile is a statistical measure that indicates the value below which a specified percentage of data in an ordered dataset falls. For example, if the 50th percentile is 20, this means that 50% of the data in the set are below 20. To calculate a percentile, first the data is ordered from smallest to largest. Then, the specific percentage of data being sought after is identified. For instance, if one wants to find the 25th percentile, they are looking for the value below which lies the 25% of the data in the set.
Once you have identified the desired percentage, the following formula is used to calculate the percentile:
\(P = \dfrac{(n+1)*x}{100}\)
- p is the percentile index
- n is the total number of data points in the set
- x is the percentage of data that you want to calculate
After calculating the percentile index, the corresponding value is found in the ordered dataset. If the percentile index is an integer, the value corresponds to that position directly. If the percentile index is a decimal number, it is interpolated linearly between the two closest values in the ordered dataset.
For example, to calculate the 25th percentile in a sorted dataset of the following way:
10, 15, 20, 25, 30, 35, 40
First, find the percentile index.
\(P = \dfrac{(7+1)*25}{100} = 2\)
The corresponding value is the second value in the dataset, which is 15. Therefore, the 25th percentile is 15.
Comparison Side by Side: Mean vs. Percentiles
Suppose a survey is conducted to evaluate user satisfaction on an online site. They are asked to rate their experience on a scale of 1 to 10. The results obtained are as follows:
| User | Rating |
|---|---|
| 1 | 6 |
| 2 | 7 |
| 3 | 8 |
| 4 | 9 |
| 5 | 10 |
If we use the average to describe user experience, we would have a score of 7.8. However, if we look at percentiles, we can see that 80% of users rated their experience as an 8 or higher. This suggests that most users had a positive experience on the website. On the other hand, if we use the average, it could hide the fact that some users had a negative experience and others had an exceptional one.
Examples and Graphics #
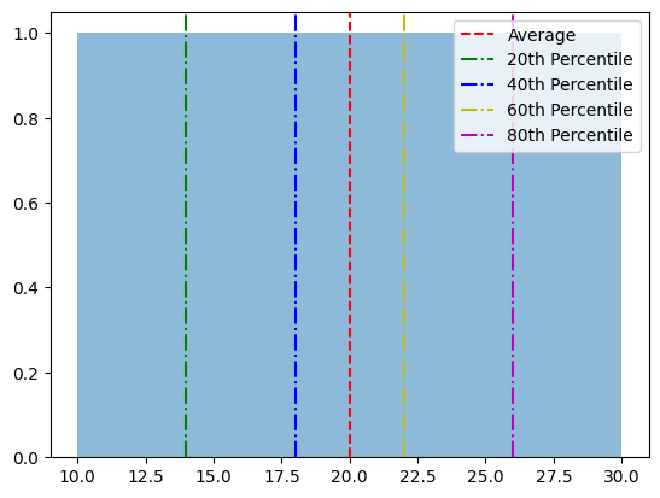
Let’s look at another example. Suppose we are measuring the time it takes for users to complete a task in an application. The results obtained are as follows:
| User | Time (seconds) |
|---|---|
| 1 | 10 |
| 2 | 15 |
| 3 | 20 |
| 4 | 20 |
| 5 | 30 |
If the average is used, there would be an average time of 20 seconds. However, if percentiles are observed, it can be seen that 80% of users completed the task in 25 seconds or less. This suggests that most users found the task easy to complete in a short amount of time.
In the following graph, there is a difference between using the mean and percentiles in this example:
JMeter Plugin #
JMeter provides a plugin that graphs the percentiles of the results from a performance test.
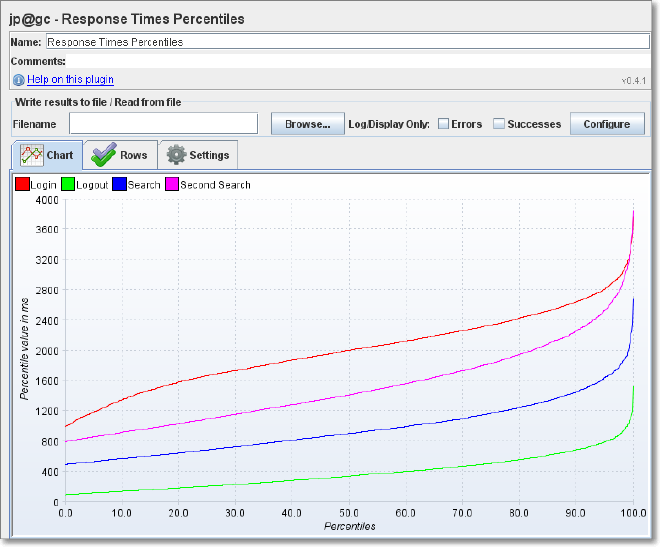
You can find more information about this plugin at this link:
Response Times Percentiles -JMeter-Plugins.org
Conclusion #
In conclusion, the use of percentiles is essential for a precise evaluation of user experience. Percentiles provide additional information that the average cannot show. By analyzing the percentiles, one can obtain a more complete picture of the general user experience and not just a measure of central tendency. To obtain an accurate evaluation of user experience, the use of percentiles is essential.