

The Three Pillars of Load Testing
Table of Contents
Beginner - This article is part of a series.

In this entry we discuss the so-called “three pillars” of load testing.
The three pillars of performance testing are: Processing Capacity, Response Time, and Utilization. These three metrics are essential for designing effective performance tests and correctly interpreting the results.
Note: in English “load testing” is known as “Load Testing or LT”, which is the term we will use in this article.
Definitions #
We start by defining a term that identifies the environment where the application runs. This term in English is known as System Under Test or SUT. Generally, SUT describes a set of components usually organized into several hardware layers, each performing a specific function. For example: application server, web server, etc.
Capacity of Processing (using the term in English: Throughput): a ratio or proportion that represents the amount of work completed within a defined period of time. For example, transactions per minute. In the case of JMeter, the listener Summary Report provides the throughput average for the total transactions and individually for each one.
Response Time (using the term in English: Response Time): is a quantity that represents the time that passes from when the user sends a transaction until they receive the complete response. In the case of JMeter, the Listener Summary Report also reports the average Response Time for the total transactions and individually for each one.
Usage (using the term in English: Utilization: a percentage that represents how much of this resource is occupied by the SUT (CPU, Memory, I/O, etc) at a specific moment.)
JMeter does not report the Utilization directly; it is necessary to install the Performance Monitoring plugin and initialize the perform-agent on the SUT. A more efficient alternative is using a Application Performance Management (APM). For example, New Relic, Dynatrace, etc.
Perspective Graphic #
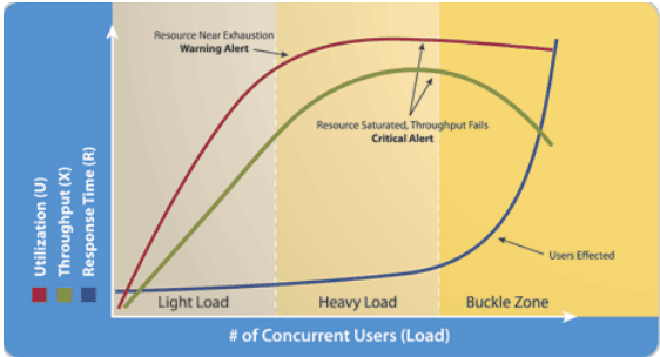
The graph shows the three metrics as a function of the load created by Concurrent Users. In other words, increases in load directly impact Throughput, Response Time, and Utilization. Initially, this relationship is more or less linear (Light Load). Eventually, subsequent increments in load that cause the relationship to transform into non-linear (Heavy and Buckle zones).
An example of this non-linear approach is CPU saturation when the number of processes exceeds the number of CPUs (Utilization). The Response Time will progressively increase as additional processes wait for execution opportunities, and consequently, the Throughput will also progressively decrease.
This concept, certainly counterintuitive, is fundamental for designing an effective load and correctly interpreting the results.
Practical Uses #
A practical use of these three metrics is in interpreting the results of a load testing. For a given number of VUsers, the Summary Report in the Summary Report shows a combination of Throughput and Response Time, but without information about the corresponding Utilization there is no way to identify which section of the graph (above) the results are located. They could be in the zone of light load, where the environment may be over-configured; alternatively, if the results are in the zone of buckle zone, an abrupt increase in load would cause test results that are unacceptable, probably because the capacity of SUT is at its limit.
Another practical use is related to the specification of requirements or goals for LT. It is usual to indicate the requirements of an LT exclusively in terms of number of users (VUsers). This requirement is incomplete because the actual number of users that a application can support is not known beforehand. A more clear requirement should be accompanied by detailed information about load, especially the frequency with which each component of the load is executed; in other words, the expected throughput. Similarly, the corresponding response time for each component of the SUT is particularly relevant. Finally, specifying the level of utilization for each one of the components of the SUT indicates the desired consumption of hardware resources.
Conclusion #
The three pillars of performance testing are essential for designing performance tests and correctly interpreting the results. What is important is that these three metrics provide context in the requirements phase, design phase, and result interpretation phase.